
Infrared thermal inspection reveals abnormal heat patterns in electrical systems—helping maintenance teams find developing issues, prioritize action and protect continuity.
Observe heat without touching the equipment.
Inspect under representative load where safely possible.
Identify unusual thermal differences between components.
Turn findings into prioritized maintenance decisions.
A loose connection, overloaded circuit or deteriorating contact may look normal from the outside. Under load, resistance creates heat. An infrared camera makes that invisible pattern visible—before the issue has the chance to become an interruption.
Thermography gives maintenance teams something more useful than a guess: a visible place to investigate.
Capture the thermal pattern.
Find abnormal differences.
Prioritize the right response.
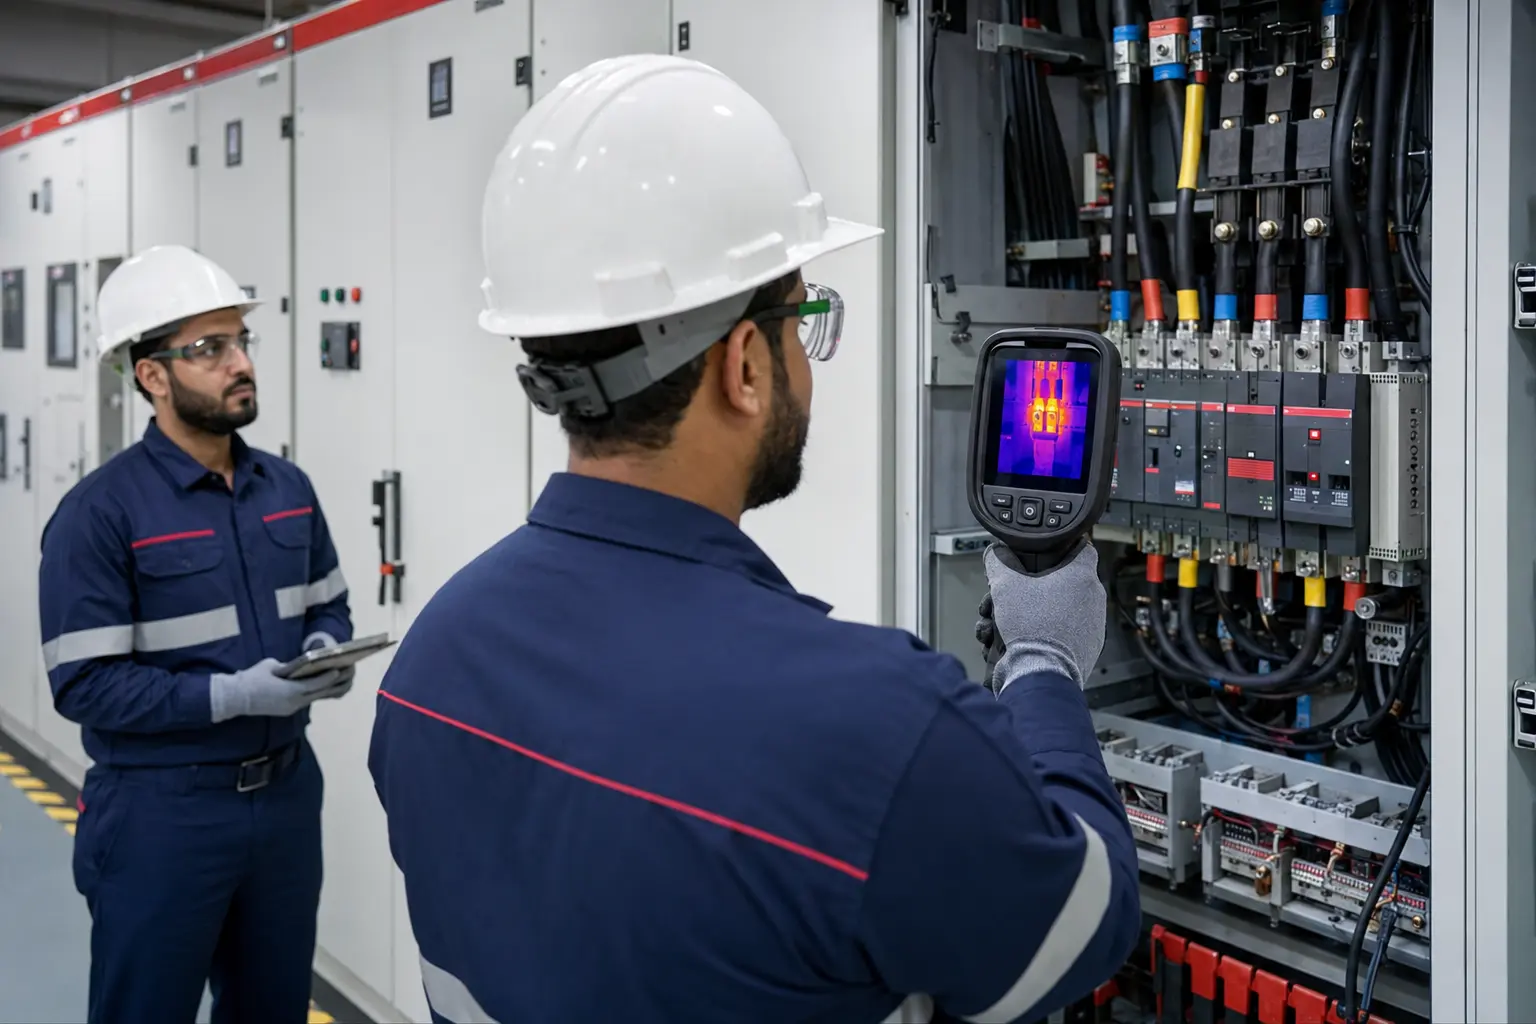
Every meaningful observation is connected to an asset, location and next action.
Thermography highlights unusual temperature patterns. The finding then guides qualified investigation and corrective maintenance.
Resistance at terminals, lugs and joints can create localized heating.
Uneven patterns may point to load distribution concerns.
Worn breakers, isolators or contact surfaces may run hotter than peers.
Fuses, cables and components can reveal developing anomalies.
A focused survey of critical electrical assets, connections and distribution points across your facility.
Incoming supplies, outgoing feeders, breakers, fuses and terminations.
Motor starters, contactors, protection devices and control connections.
Bolted connections, cable lugs, joints and high-current paths.
Terminations, cooling patterns and accessible connection points.
Power electronics, battery connections and supporting distribution.
Supply connections, terminals and comparative operating temperatures.
The value is not simply taking thermal images. It is connecting each image to the equipment, operating context, severity and next action.
Confirm asset scope, access, loading and safety requirements.
Record thermal and matching visual images of each asset.
Compare patterns, temperatures and similar components.
Classify findings by observed condition and urgency.
Issue evidence and support follow-up after corrective work.
Representative operating load helps temperature differences become visible—subject to safe access and the agreed inspection plan.
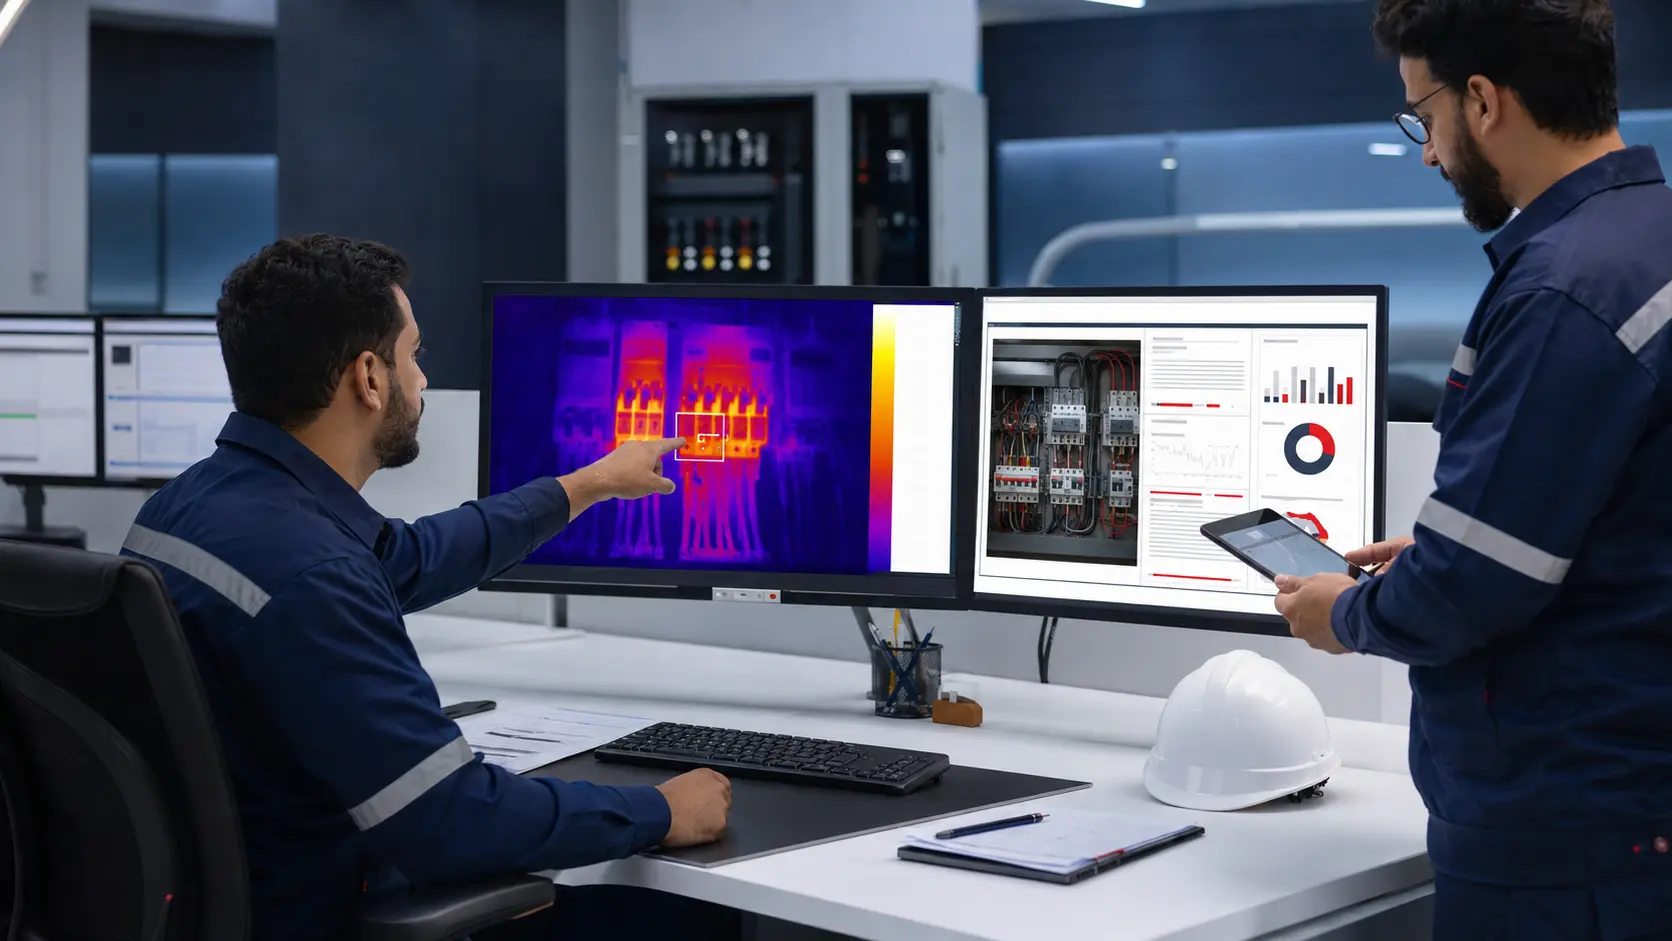
Every meaningful finding is connected to a maintenance decision.
A thermogram becomes valuable when people know what asset it belongs to, what the temperature pattern means and what should happen next.
Equipment, location and inspected component.
Matched evidence for clear recognition.
Observed values and comparative context.
Clear maintenance attention category.
Practical next step for qualified personnel.
Evidence to support repair verification.
Thermal evidence helps maintenance teams focus attention where the system is already showing stress.
Make an abnormal heat pattern visible before a routine visual check would reveal it.
Use the observed condition to direct maintenance attention and further investigation.
Return after corrective work and compare the thermal condition where appropriate.
Suitable for planned condition monitoring across many facility and infrastructure settings.
Main distribution, tenant supplies and facility systems.
Switchgear, MCCs, plant distribution and critical loads.
UPS, distribution and continuity-sensitive equipment.
Electrical assets in demanding operational environments.
Planned surveys supporting preventive maintenance programs.
Electrical thermography requires careful planning around access, loading, safe working boundaries and equipment identification.
Plan an electrical thermographic survey for your switchboards, panels and critical distribution assets.